
AI Rental Investment Analyzer
Get investment analysis report - just enter purchase price, rent, expenses.
Rental Investment Analysis
Property: [[Property Full Address]], [[City]], [[State]] [[ZIP Code]]
Prepared For: [[Investor / Client Name]]
Prepared By: [[Analyst / Advisor Name and Firm]]
Report Date: [[Report Date]]
Analysis Period: 12-month pro forma beginning [[Projection Start Date]]
This Rental Investment Analysis provides a complete pro forma projection of income, expenses, cash flow, and returns for the subject rental property. All figures are expressed using [[Token Name]] placeholders. The analysis incorporates standard real estate investment metrics including:
- Cap Rate = Net Operating Income (NOI) ÷ Current Market Value
- Cash-on-Cash Return = Annual Pre-Tax Cash Flow ÷ Total Cash Invested
- Gross Rent Multiplier (GRM) = Purchase Price ÷ Annual Gross Rent
- Vacancy and credit loss assumptions
- 12-month monthly cash flow projection
This is an analytical model only and does not constitute financial, tax, or investment advice. Actual results will vary based on market conditions, tenant performance, operating expenses, financing terms, and management.
1. Key Assumptions and Inputs
Purchase Price / Current Market Value: $[[Purchase Price or Current Market Value]]
Down Payment: [[Down Payment Percent]]% ($[[Down Payment Amount]])
Loan Amount: $[[Loan Amount]]
Interest Rate (Annual): [[Interest Rate]]%
Loan Term: [[Loan Term Years]] years
Monthly Principal & Interest (P&I): $[[Monthly Debt Service P&I]]
Other Monthly Debt Costs (if any, e.g. PMI): $[[Additional Monthly Debt Costs]]
Total Monthly Debt Service: $[[Total Monthly Debt Service]]
Total Cash Invested (Down + Closing Costs + Initial Reserves): $[[Total Cash Invested]]
Holding Period for Return Metrics: [[Holding Period Years]] years
2. Income and Vacancy Assumptions
Gross Potential Monthly Rent: $[[Gross Monthly Rent]]
Annual Gross Potential Rent: $[[Annual Gross Potential Rent]]
Vacancy Rate Assumption: [[Vacancy Rate]]% (industry typical 5-8% for stabilized residential; adjust for local market)
Credit Loss / Bad Debt Assumption: [[Credit Loss Rate]]% of potential rent
Effective Gross Income (EGI) Monthly (after vacancy/credit): $[[Effective Gross Monthly Income]]
Annual Effective Gross Income: $[[Annual Effective Gross Income]]
Other Income (laundry, parking, fees, etc.): $[[Monthly Other Income]] / $[[Annual Other Income]]
3. Operating Expenses (Annual)
| Expense Category | Annual Amount | Notes / Assumptions |
|---|---|---|
| , , , , , | , , , , - | , , , , , - |
| Property Taxes | $[[Annual Property Taxes]] | Based on assessed value and millage rate |
| Insurance (Hazard/Landlord) | $[[Annual Insurance]] | [[Coverage Notes]] |
| Property Management | $[[Annual Property Mgmt]] | [[Percent of EGI or fixed]]% of EGI |
| Maintenance & Repairs | $[[Annual Maintenance]] | [[% or fixed]] |
| Capital Expenditure Reserve | $[[Annual CapEx Reserve]] | [[Amount per unit or %]] |
| Utilities (Owner-Paid) | $[[Annual Owner Utilities]] | [[Which utilities]] |
| HOA / Condo Fees (if any) | $[[Annual HOA]] | [[Per month x12]] |
| Marketing / Leasing / Turnover | $[[Annual Leasing Costs]] | Vacancy turnover allowance |
| Other / Professional Fees | $[[Annual Other OpEx]] | Legal, accounting, licenses |
| Total Operating Expenses | $[[Total Annual OpEx]] |
4. Net Operating Income (NOI) and Return Metrics
Net Operating Income (NOI) = Effective Gross Income − Operating Expenses
- Annual NOI: $[[Annual NOI]]
- Monthly NOI (average): $[[Monthly NOI]]
Cap Rate = NOI ÷ Current Market Value
- Cap Rate = $[[Annual NOI]] ÷ $[[Purchase Price or Current Market Value]] = [[Cap Rate Percent]]%
Cash Flow Calculation
Annual Debt Service (P&I + other): $[[Annual Debt Service]]
Annual Pre-Tax Cash Flow = Annual NOI − Annual Debt Service = $[[Annual NOI]] − $[[Annual Debt Service]] = $[[Annual Pre-Tax Cash Flow]]
Cash-on-Cash Return = Annual Pre-Tax Cash Flow ÷ Total Cash Invested
- CoC Return = $[[Annual Pre-Tax Cash Flow]] ÷ $[[Total Cash Invested]] = [[Cash on Cash Percent]]%
Gross Rent Multiplier (GRM) = Purchase Price ÷ Annual Gross Potential Rent
- GRM = $[[Purchase Price]] ÷ $[[Annual Gross Potential Rent]] = [[GRM Value]]
Debt Service Coverage Ratio (DSCR) = NOI ÷ Annual Debt Service
- DSCR = $[[Annual NOI]] ÷ $[[Annual Debt Service]] = [[DSCR Ratio]]
5. 12-Month Cash Flow Projection
| Month | Gross Rent | Vacancy/Credit Loss | Effective Income | Operating Expenses | NOI | Debt Service | Pre-Tax Cash Flow |
|---|---|---|---|---|---|---|---|
| , , - | , , , | , , , , , - | , , , , , | , , , , , | , - | , , , , | , , , , , - |
| 1 | $[[M1 Gross]] | $[[M1 Vac]] | $[[M1 EGI]] | $[[M1 OpEx]] | $[[M1 NOI]] | $[[M1 Debt]] | $[[M1 Cash]] |
| 2 | $[[M2 Gross]] | $[[M2 Vac]] | $[[M2 EGI]] | $[[M2 OpEx]] | $[[M2 NOI]] | $[[M2 Debt]] | $[[M2 Cash]] |
| 3 | $[[M3 Gross]] | $[[M3 Vac]] | $[[M3 EGI]] | $[[M3 OpEx]] | $[[M3 NOI]] | $[[M3 Debt]] | $[[M3 Cash]] |
| 4 | $[[M4 Gross]] | $[[M4 Vac]] | $[[M4 EGI]] | $[[M4 OpEx]] | $[[M4 NOI]] | $[[M4 Debt]] | $[[M4 Cash]] |
| 5 | $[[M5 Gross]] | $[[M5 Vac]] | $[[M5 EGI]] | $[[M5 OpEx]] | $[[M5 NOI]] | $[[M5 Debt]] | $[[M5 Cash]] |
| 6 | $[[M6 Gross]] | $[[M6 Vac]] | $[[M6 EGI]] | $[[M6 OpEx]] | $[[M6 NOI]] | $[[M6 Debt]] | $[[M6 Cash]] |
| 7 | $[[M7 Gross]] | $[[M7 Vac]] | $[[M7 EGI]] | $[[M7 OpEx]] | $[[M7 NOI]] | $[[M7 Debt]] | $[[M7 Cash]] |
| 8 | $[[M8 Gross]] | $[[M8 Vac]] | $[[M8 EGI]] | $[[M8 OpEx]] | $[[M8 NOI]] | $[[M8 Debt]] | $[[M8 Cash]] |
| 9 | $[[M9 Gross]] | $[[M9 Vac]] | $[[M9 EGI]] | $[[M9 OpEx]] | $[[M9 NOI]] | $[[M9 Debt]] | $[[M9 Cash]] |
| 10 | $[[M10 Gross]] | $[[M10 Vac]] | $[[M10 EGI]] | $[[M10 OpEx]] | $[[M10 NOI]] | $[[M10 Debt]] | $[[M10 Cash]] |
| 11 | $[[M11 Gross]] | $[[M11 Vac]] | $[[M11 EGI]] | $[[M11 OpEx]] | $[[M11 NOI]] | $[[M11 Debt]] | $[[M11 Cash]] |
| 12 | $[[M12 Gross]] | $[[M12 Vac]] | $[[M12 EGI]] | $[[M12 OpEx]] | $[[M12 NOI]] | $[[M12 Debt]] | $[[M12 Cash]] |
| Annual Total | $[[Annual Gross Total]] | $[[Annual Vac Total]] | $[[Annual EGI Total]] | $[[Annual OpEx Total]] | $[[Annual NOI Total]] | $[[Annual Debt Total]] | $[[Annual Cash Flow Total]] |
*Note: Monthly figures assume even distribution; actual seasonality or rent changes can be modeled by adjusting individual months.*
6. Rule-of-Thumb Sanity Checks
1% Rule: Monthly rent should be at least 1% of purchase price.
- Target: $[[Purchase Price]] × 0.01 = $[[1% Target]]
- Actual Gross Monthly Rent: $[[Gross Monthly Rent]]
- Status: [[Meets / Below / Above 1% Rule]]
50% Rule: Operating expenses (excluding debt service) are often ~50% of gross rent for many residential properties.
- Estimated OpEx: $[[Total Annual OpEx]]
- 50% of Annual Gross: $[[50% of Annual Gross]]
- Actual OpEx as % of Gross: [[OpEx Percent of Gross]]%
7. Sensitivity Analysis
| Scenario | Monthly Rent Change | Vacancy Rate | Annual Cash Flow | Cap Rate | CoC Return |
|---|---|---|---|---|---|
| , , , | , , , , , - | , , , , | , , , , , | , , , | , , , |
| Base Case | $[[Base Monthly Rent]] | [[Base Vac]]% | $[[Base Annual CF]] | [[Base Cap]]% | [[Base CoC]]% |
| Optimistic (+10% rent) | +10% | [[Opt Vac]]% | $[[Opt Annual CF]] | [[Opt Cap]]% | [[Opt CoC]]% |
| Conservative (−5% rent, +2% vac) | −5% | [[Cons Vac]]% | $[[Cons Annual CF]] | [[Cons Cap]]% | [[Cons CoC]]% |
| Stress (higher rates) | Base | Base | Adjusted for rate | [[Stress Cap]]% | [[Stress CoC]]% |
Interest rate sensitivity: Each 1% increase in mortgage rate increases annual debt service by approximately $[[Debt Impact Per Rate Point]] (adjust for actual amortization).
8. Breakeven Occupancy
Breakeven Occupancy = (Operating Expenses + Debt Service) ÷ Gross Potential Rent
- Annual OpEx + Debt Service: $[[OpEx + Annual Debt]]
- Annual Gross Potential Rent: $[[Annual Gross Potential Rent]]
- Breakeven Occupancy Rate: [[Breakeven Percent]]%
The property must maintain occupancy above this level (after credit loss) to cover all operating costs and debt service from operations.
9. Additional Metrics and Notes
Equity Build / Amortization (Year 1 estimate): $[[Annual Principal Reduction]]
Projected Appreciation Assumption: [[Appreciation Rate]]% per year
Simple 5-Year IRR (illustrative, pre-tax, no sale costs): [[Illustrative IRR]]% (full discounted cash flow modeling recommended with exit cap rate and sale proceeds).
Total 5-Year Cash Flow (undiscounted): $[[Cumulative 5yr CF]]
Risk Factors: Local market vacancy, rent control exposure (verify locally), unexpected capital needs, interest rate risk on refinance, tenant default, regulatory changes., -
*Template, not professional financial, investment, tax, or legal advice. Projections use assumptions provided via [[tokens]] and standard formulas. Verify all inputs against current market data, appraisals, tax assessments, insurance quotes, and local regulations. Cap rate, CoC, GRM, and DSCR are industry-standard but do not guarantee performance. Consult a licensed financial advisor, CPA, and real estate professional.*
*Formulas: Cap Rate = NOI ÷ Market Value; Cash-on-Cash = Pre-Tax CF ÷ Cash Invested; GRM = Price ÷ Annual Gross Rent. Analysis as of June 2026.*
Illustrative preview - your actual result is built from your inputs.
How it works.
Rental Investment Analyzer: provide purchase price, rent, expenses, financing terms and get a complete investment analysis report in minutes - including cash flow statement, cap rate, cash-on-cash return. Free AI workflow, no signup required to preview.
 Audits, Analyses & Reports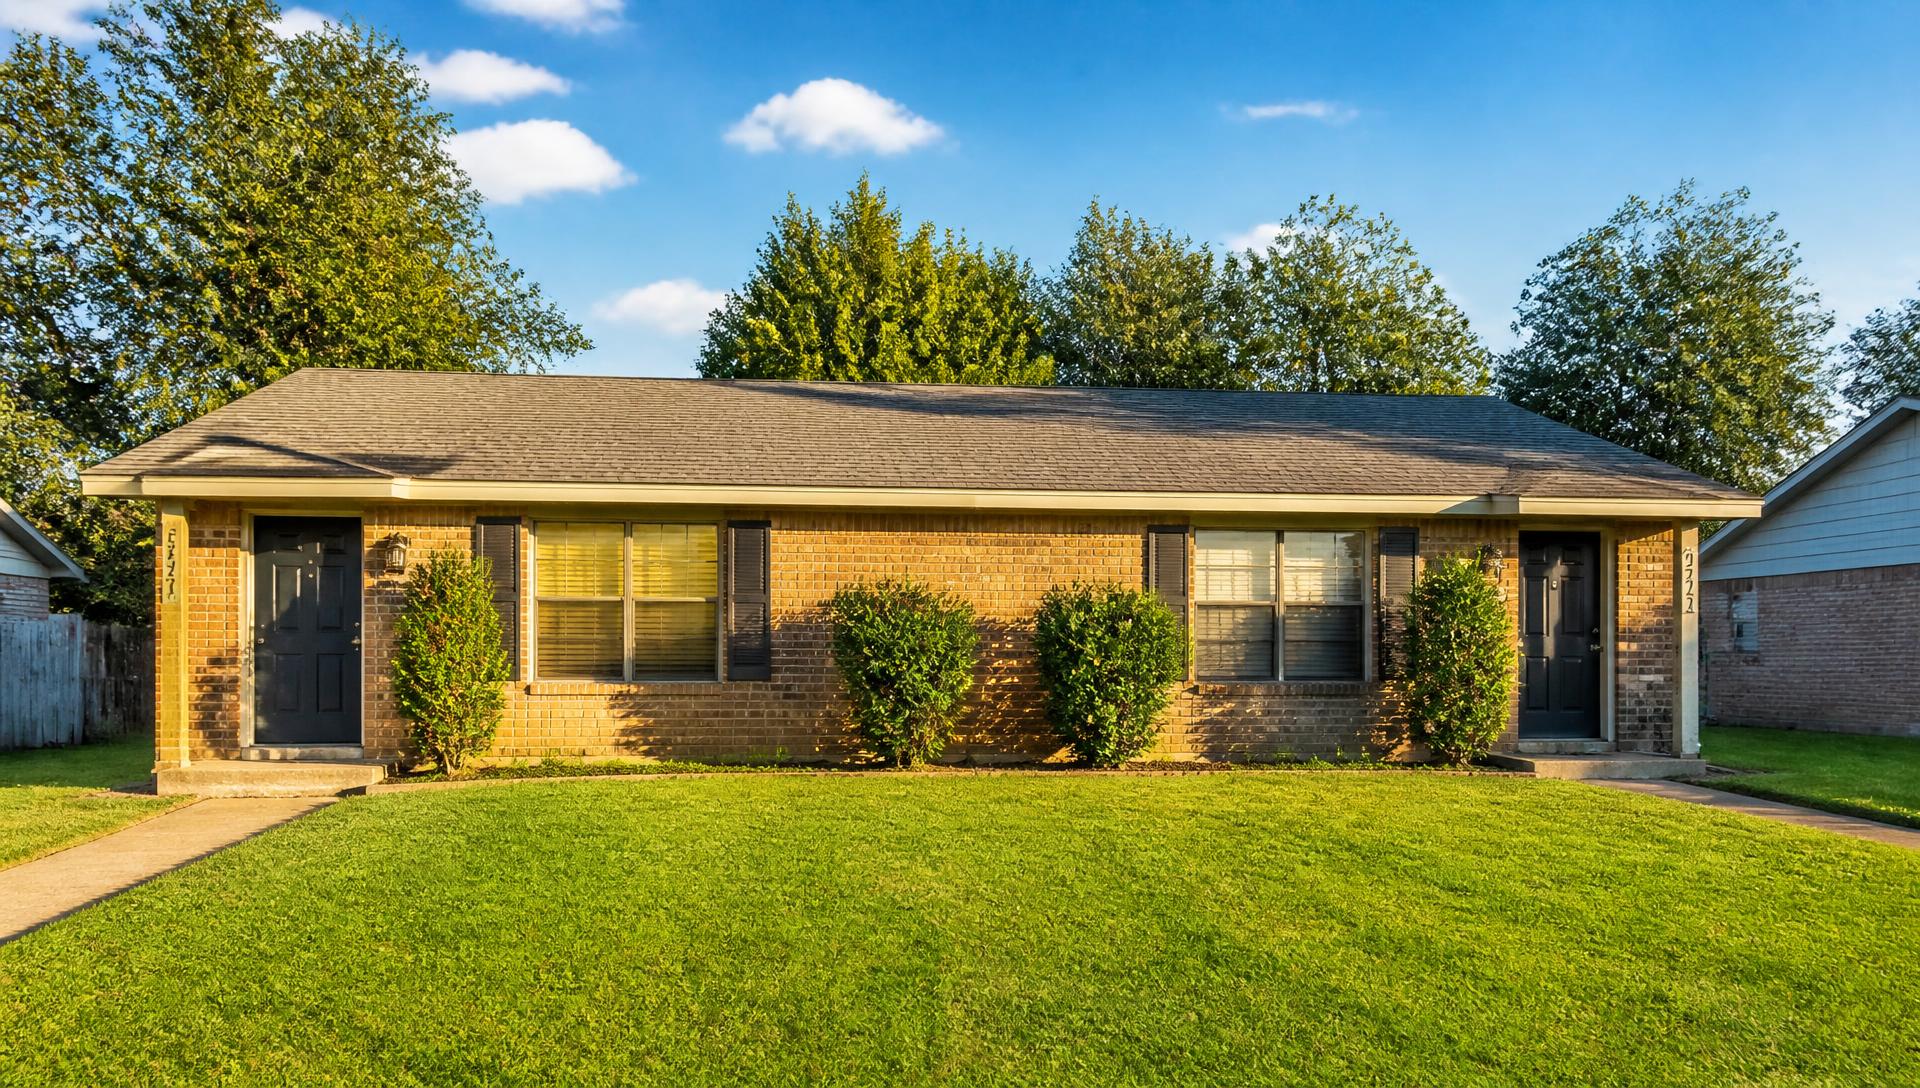
Pro forma with NOI -> cash flow -> returns (cap rate, CoC, DSCR, IRR) + sensitivity.
What good looks like.
What it must include
- 01Purchase price, financing (down, rate, term) and resulting debt service
- 02gross rent, vacancy/credit loss, operating expenses (taxes, insurance, mgmt, maintenance, capex reserve, HOA, utilities)
- 03NOI, cap rate, cash flow, cash-on-cash return, DSCR, GRM
- 041% rule and 50% rule sanity checks
- 05IRR/equity multiple with appreciation and amortization
- 06sensitivity (rent/vacancy/rate)
- 07breakeven occupancy
Signals of expertise
- ★Including capex reserves and vacancy (not just PITI), DSCR for lender view, cash-on-cash vs cap rate distinction, the 1%/50% rules of thumb, IRR over hold period.
Common mistakes
- ×Omitting vacancy/capex/management
- ×confusing cap rate with cash-on-cash
- ×ignoring debt service in cap rate
- ×optimistic rent
 Numbers that hold
 Money terms
 Drafted fast
More in Audits, Analyses & Reports.


Get your ready-to-use investment analysis report in minutes.
Answer a few questions and download a ready-to-serve document today.